Market
Market
Comparative Long-Term Waterfront Market Trends: Lake Muskoka, Lake Rosseau & Lake Joseph

Lake Muskoka, Lake Rosseau, and Lake Joseph:
More Different Than You Think
I get asked regularly whether the Big Three lakes are really the same market. After spending time digging into historical MLS data, the honest answer is no. They share the same long-term story of limited supply and sustained buyer interest, but each lake behaves quite differently in terms of how prices move, how quickly they respond to change, and what actually drives a transaction. Understanding those differences matters, whether you are buying, selling, or just trying to make sense of the numbers.
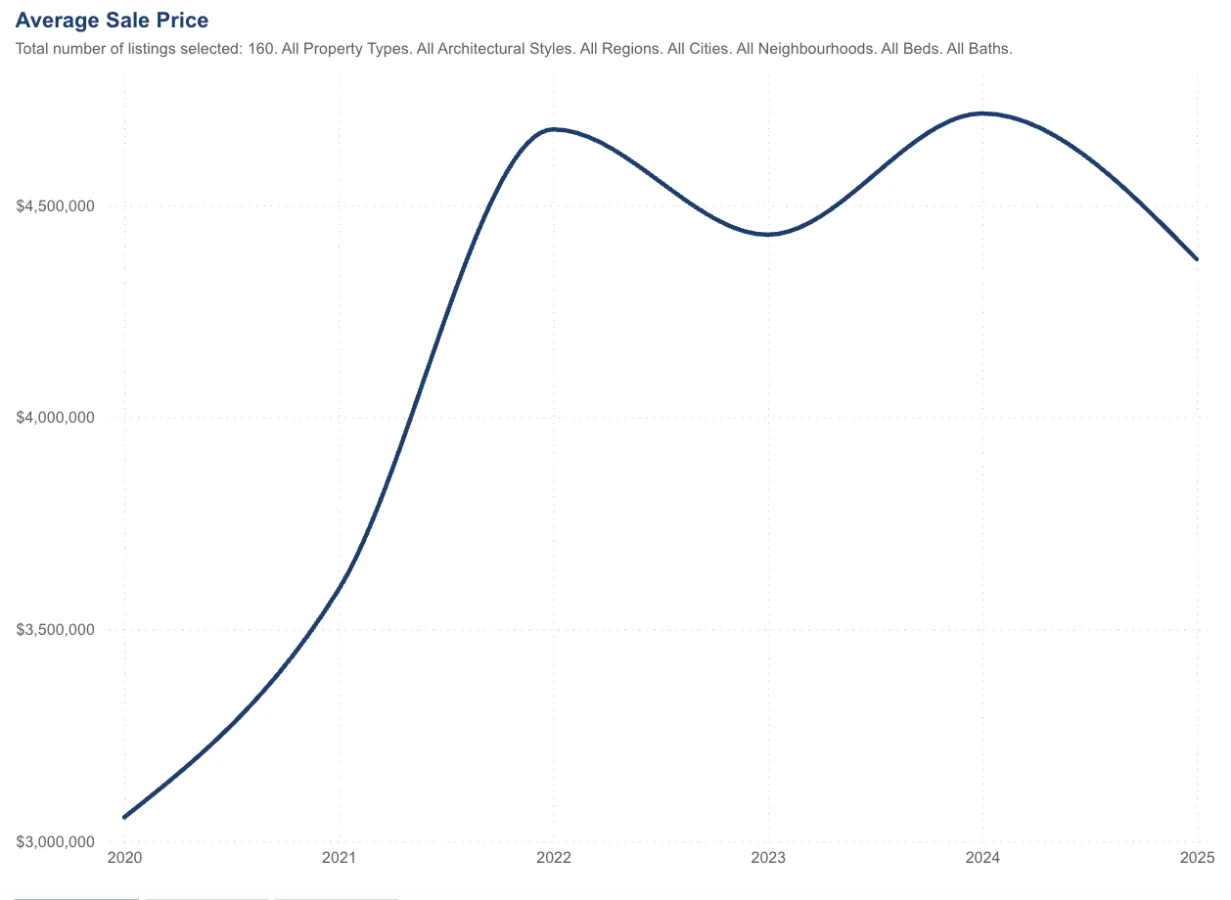
Lake Muskoka
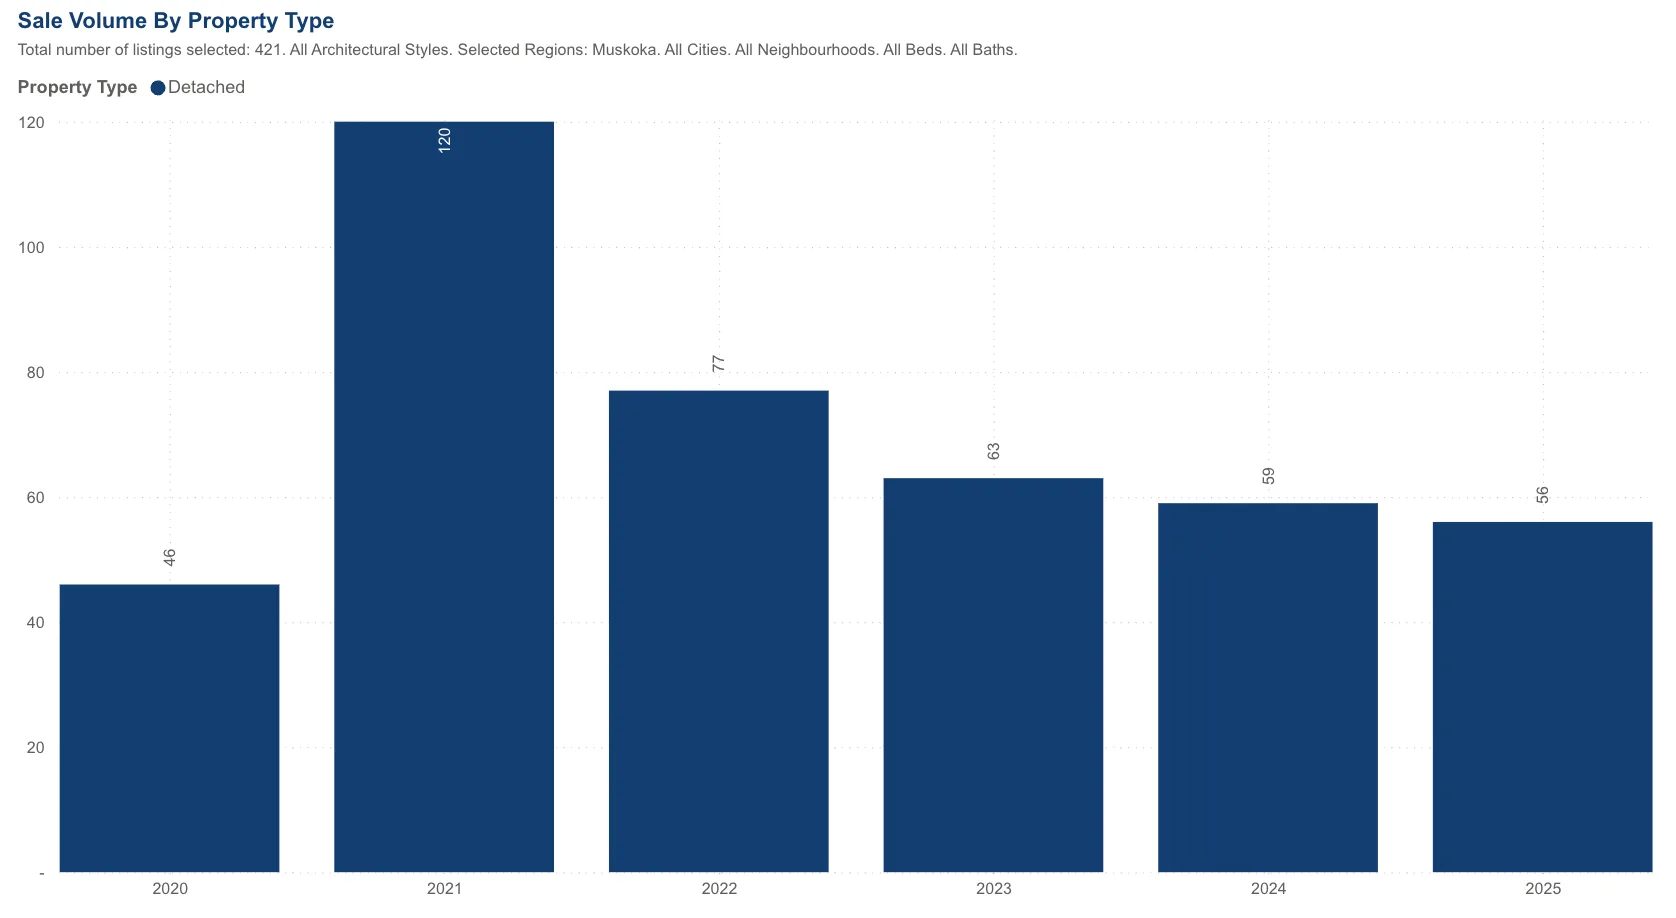
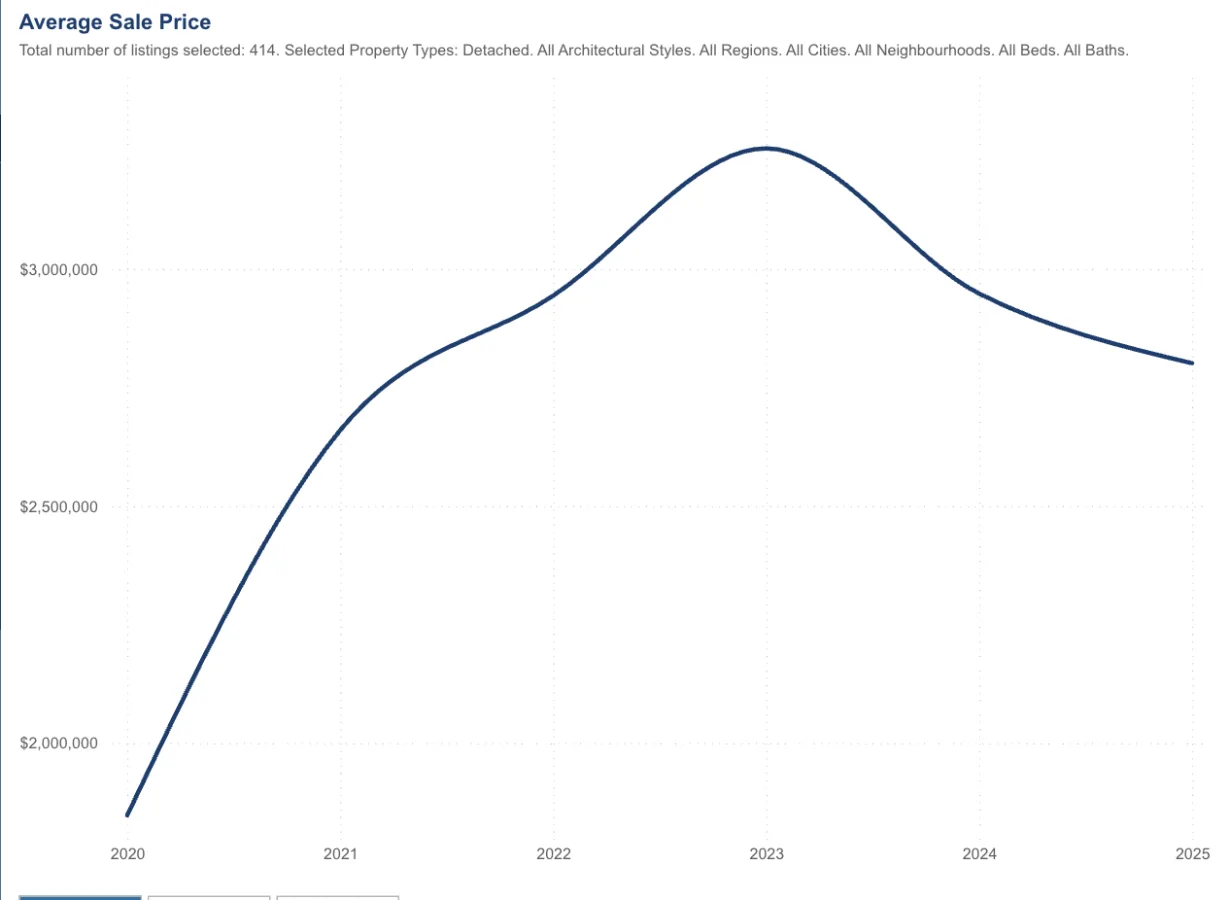
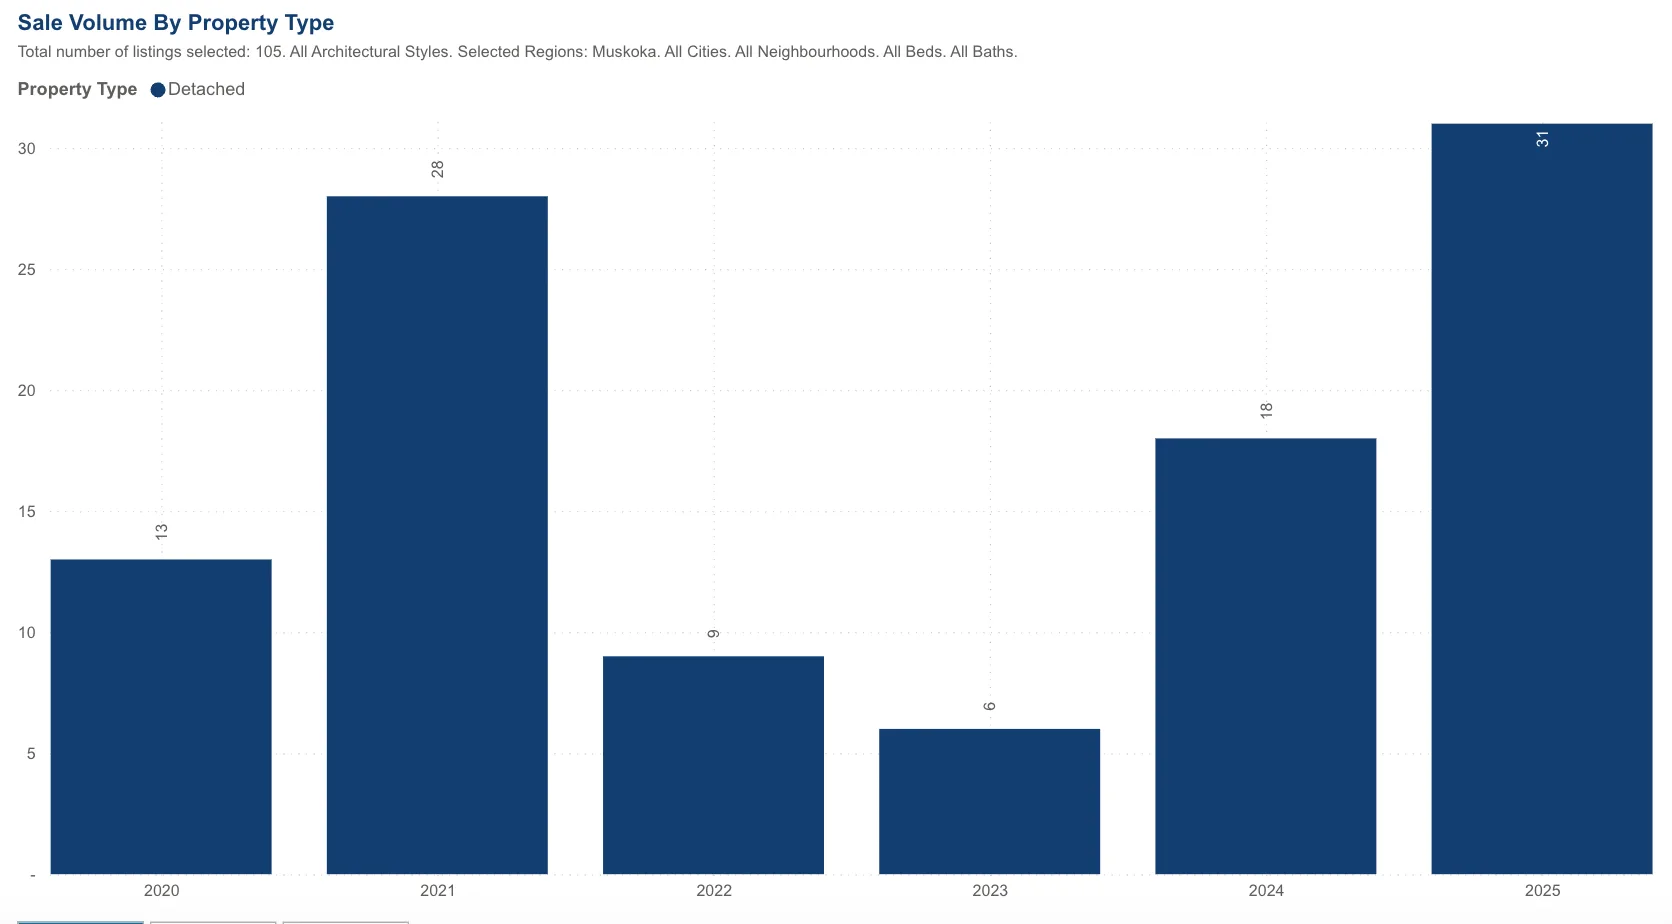
Lake Muskoka is the most active waterfront market of the three, typically recording 50 to 85 sales in a normal year. That level of activity is what sets it apart. With enough transactions to give you statistically meaningful pricing data, Lake Muskoka functions as the clearest window into what is actually happening in the Muskoka waterfront market, and as an early signal for where the other two lakes are likely heading.
Long-Term Growth
From 2010 to 2020, the annual median sale price on Lake Muskoka grew from roughly $480,000 to approximately $1.9 million. That is nearly a 4x increase over a decade, and it happened across multiple interest rate environments without any unusual demand shock. The appreciation was real and structural, driven by consistent demand meeting very limited supply.
The Pandemic Years and What Followed
The surge from 2021 through 2023 pushed prices well beyond the long-term trend line. It was not a new baseline. It was a temporary demand shock where buyers competed urgently for almost no available inventory. Lake Muskoka felt it first and most sharply because its higher volume means prices react quickly, especially below $3 million. Since 2023 the market has been adjusting in an orderly way, with volumes softening before pricing followed. Early signs of stabilization are showing up in the most recent data.
indicator
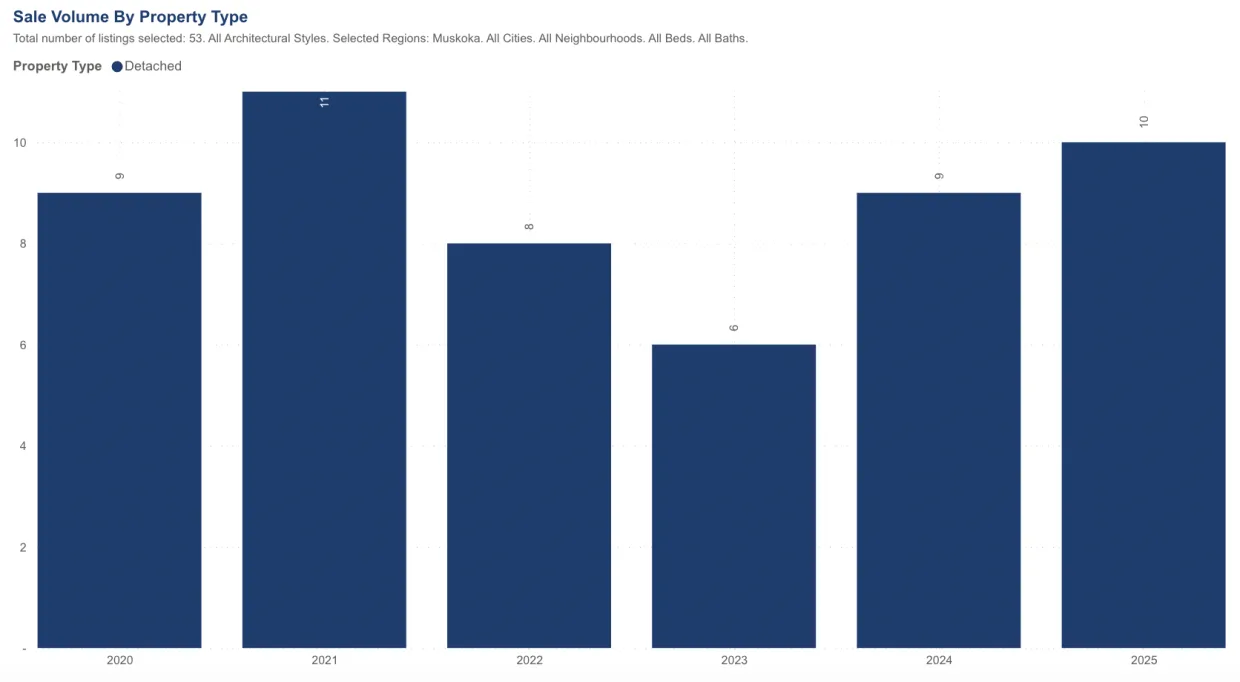
Lake Rosseau
Rosseau typically sees somewhere in the low double digits for annual transactions in a normal year, far fewer than Lake Muskoka. That matters for how you read the data: a single high-value sale can shift the annual median meaningfully, which is why year-to-year comparisons on Rosseau can look noisy even when the underlying market is relatively stable. The story on Rosseau is one of scarcity and prestige, not volume.
Slower to Move, But It Does Move
Rosseau tends to lag Lake Muskoka by somewhere between six months and two years when it comes to price adjustments. That lag works in both directions. When the broader market turns upward, Rosseau takes time to follow. When it softens, Rosseau sellers who don’t need to sell simply don’t, which suppresses transaction volume before it suppresses prices. The post-pandemic adjustment on Rosseau happened mainly through extended marketing times and targeted repricing on individual properties, not any broad-based correction.
What Drives Pricing Here
Rosseau buyers at the upper end of the market are driven less by mortgage rates and more by discretionary wealth and confidence. When that changes, Rosseau is slower to respond than Lake Muskoka but ultimately follows the same directional path. The absence of any signs of distressed selling in the post-pandemic period underscores how structurally resilient this market is.
months
scarcity
Lake Joseph
Lake Joseph is the thinnest market of the three. Many months record no sales at all, and the annual total in a normal year sits in the low double digits. The practical consequence of this is that you simply cannot read monthly or even annual statistics on Lake Joseph the same way you might on Lake Muskoka. A single high-value sale in a quiet period can swing the median price by hundreds of thousands of dollars without reflecting any real change in what properties are worth.
Why the Numbers Can Look Misleading
Lake Joseph’s pricing is shaped less by trading activity and more by extreme scarcity and a strong long-term ownership culture. Many properties here have been in the same family for decades. When something does come to market, buyers know they may not see a comparable opportunity for years. That dynamic creates real underlying value, but it also means that short-term statistics can be badly distorted by timing and property mix in any given year.
What Actually Drives This Market
Lake Joseph buyers are largely not constrained by mortgage rates or short-term economic conditions. Purchases here are driven by long-term lifestyle decisions and generational thinking. The result is that Joe tends to appear disconnected from broader market trends in both rising and falling markets, and both patterns are explained by the same thing: thin volume and discretionary sellers who have no pressure to act at any particular time. Where price adjustments have occurred post-pandemic, they have been property-specific, not broad-based.
low
timing
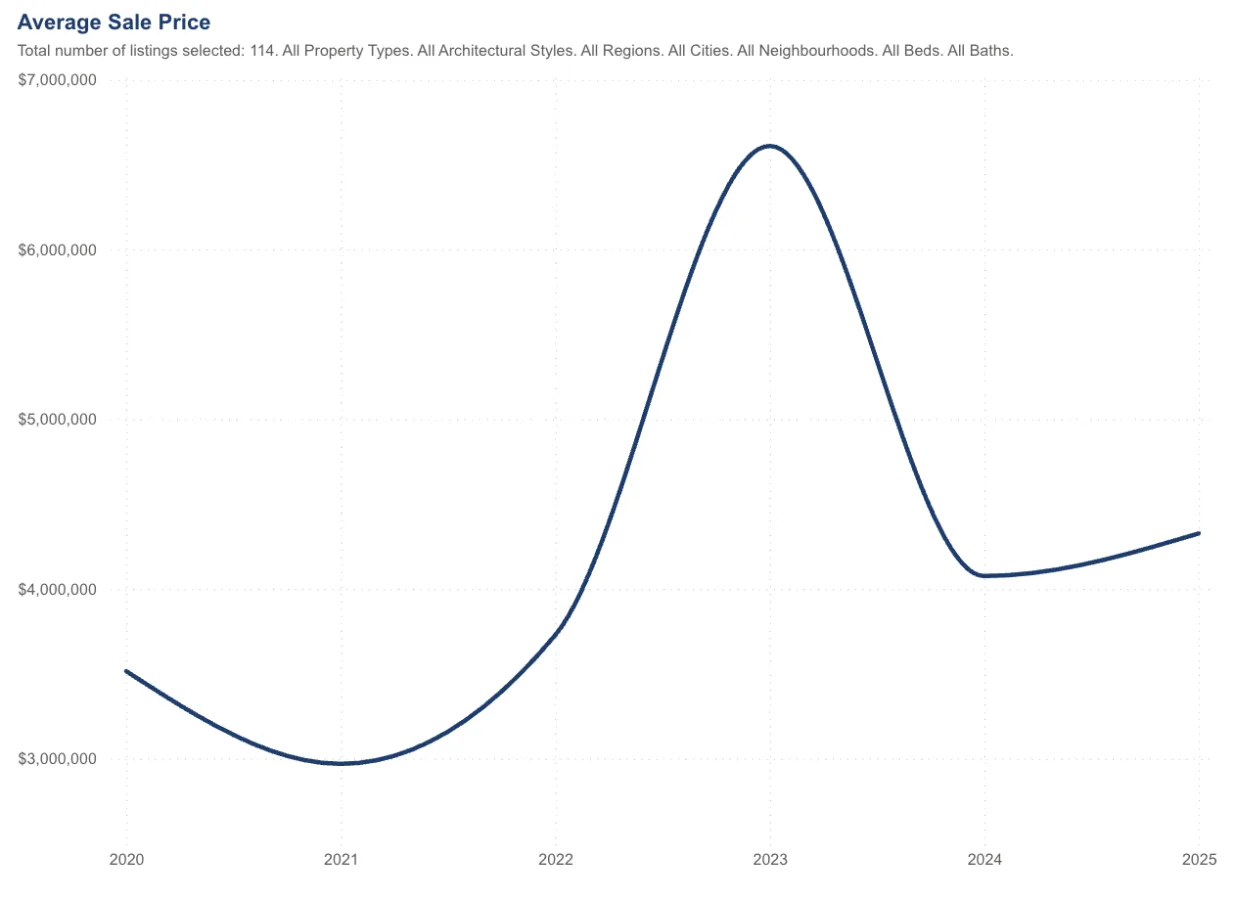
A Market Unto Itself
People often group Little Lake Joseph informally with Lake Joseph, but from a market standpoint it operates as a genuinely separate boutique micro-market. Annual transaction volume is extremely low, often just one or two sales, and prices have clustered mostly between $3M and $7M in recent years. A single sale can shift the perceived pricing significantly, making any kind of statistical trend analysis unreliable.
Unlike core Lake Joseph, value here is driven almost entirely by property-specific factors: privacy, frontage quality, orientation, and the quality of existing structures. Several recent sales closed at or near full asking price even during softer broader market periods, which reflects the depth of demand that exists when the right property appears. The lesson is to avoid valuing any Little Lake Joseph property using regional averages. This is a market that requires lake-specific knowledge and a case-by-case approach.
The Volatility Is About When People Sell, Not What Properties Are Worth
The price swings we see across all three lakes are driven less by changes in demand and more by when owners choose to participate. That is the most important thing to understand about how these markets work.
Lake Muskoka adjusts first and most visibly because it has the most transactions. More sales means prices react faster to shifts in buyer behaviour, particularly below $3 million. Lake Rosseau follows with a delay, because fewer properties trade and sellers are more patient. Lake Joseph shows the least short-term movement of all, not because demand is weaker, but because so few owners sell in any given year that price signals emerge very slowly.
The volatility of 2020 through 2022 was a period of unusually high participation, owners choosing to sell into extraordinary demand, buyers choosing to act at almost any price. It was not a permanent reset in what Muskoka waterfront is worth. Over the long run, market structure and the timing of seller decisions matter far more than any single cycle of data.
Understanding these patterns helps you avoid reading pandemic-era comps on Rosseau or Joseph as the new normal, and helps you recognize when Lake Muskoka’s leading-indicator behaviour suggests a broader shift is coming. See our Buyers Guide and the Ontario Cottage Market Forecaster for current conditions.
If you are on Rosseau or Joseph, your value is shaped more by when you come to market than by any regional index. Timing, presentation, and pricing against genuine comparable sales matter far more than following the trend. Read our Sellers Guide or talk to us directly about what your property is worth right now.
If You Bought in 2010 for $400,000
We track how the value of a typical Ontario waterfront property purchased for $400,000 in 2010 would have changed over time, based on actual year-to-year changes in median sale prices. Toggle the comparisons to add Muskoka, Parry Sound, or Haliburton alongside the Ontario baseline.
Values indexed to $400,000 in 2010, based on annual median sale price movements shown as a 12-month rolling average. Waterfront includes all waterfront property types. Shaded bands show the pandemic period (2020–2022) and an illustrative −10% 2026 projection.
Related Articles and Tools
Questions About the Data or Your Property?
If you want to talk through what any of this means for a specific property or a purchase you are considering, we are happy to have that conversation.