
Market
Market
Haliburton & Kawartha Cottage Market Q3 2026: Record Supply
Q3 2026 Market Report
The Haliburton & Kawartha Lakes Cottage Market, By the Numbers
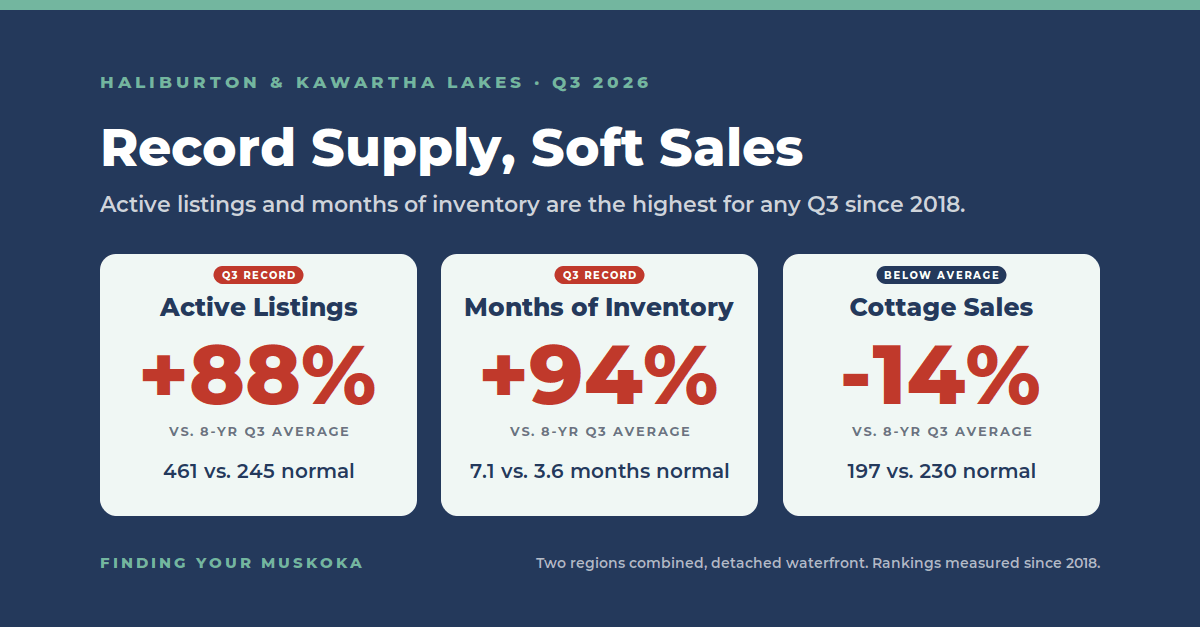
Q3 is in for Haliburton and Kawartha Lakes, with all three months confirmed, and supply is at a record. Active listings averaged 461, the highest third quarter in our data since 2018, and months of inventory hit 7.1, nearly double the 8‑year norm. Sales slipped 7 percent from last year to 197, which is 14 percent below the 8‑year average. Here are the details.
Q3 2026 vs Q3 2025 / At a glance
Active listings
Months of inventory
Sell-through
New listings
Cottage sales
Avg. sale to list price
Haliburton and Kawartha Lakes are combined (see the note at the end of this report). Q3 2026 vs Q3 2025 figures cover detached waterfront cottages, multiple real estate boards. July, August and September 2026 are all confirmed. 8‑yr averages use 2018–2025. Rankings such as “record” and “second highest” are measured against 2018 onward, the years with consistent board coverage.
Active listings across Haliburton and Kawartha Lakes averaged 461 in Q3 2026. That's the highest third quarter in our data since 2018, the first year with consistent board coverage, and 88 percent above the 8‑year Q3 average of 245. July's 485 was the highest single month in that window, and August's 473 came second. This number has climbed three summers running, and the last two each set a new high.
More listings and fewer sales is how you get 7.1 months of inventory, also the highest for a Q3 since 2018 and nearly double the 8‑year norm of 3.6. New listings came in at 445, down 4 percent on last year but still 24 percent above the 8‑year norm. Only 44 of every 100 sold, against 64 on the average.
Sales are the soft spot. We sold 197 waterfront properties, 7 percent fewer than last year's 211 and 14 percent below the 8‑year Q3 average of 230. That's the gap in this market right now: record supply meeting below‑average demand.
The Record
The most listings we've seen since 2018
Here's active listings for every third quarter since 2018, the first year with consistent board coverage across these two regions.
Active listings, Q3 average, 2018 to 2026
Average of the July, August and September active listing counts · Haliburton and Kawartha Lakes combined, detached waterfront
Source: MLS® board data, detached waterfront cottages, Haliburton and Kawartha Lakes combined, multiple real estate boards, Q3 of each year from 2018 through 2026.
In 2023 the Q3 average was 135. It has gone up every summer since: 355, then 426, and now 461. The pre‑pandemic peak was 368 in 2019, and we are 25 percent above that.
Unlike the other regions we cover, months of inventory didn't ease over the summer here. It went up, from 6.4 in Q2 to 7.1 in Q3, because the number of active listings grew by 22 percent while sales grew by only 6 percent.
What's Not Selling
Sell-through has been flat for two years, well below normal
Q3 sell-through was 44 percent: 197 sales against 445 new listings. That is down slightly from 46 percent last year and well below the 64 percent 8‑year average. The chart below tracks it over a rolling 12 months, which smooths out the seasonal swing.
Sell‑through: 12‑month rolling share of new listings that became a sale
December 2018 through September 2026 · Haliburton and Kawartha Lakes combined, detached waterfront
Scroll to explore →
Source: MLS® board data, detached waterfront cottages, Haliburton and Kawartha Lakes combined, multiple real estate boards, December 2018 through September 2026. Sell‑through is sales divided by new listings.
Over the 12 months to September 2026, 515 cottages sold against 1,405 new listings, a sell‑through of 36.7 percent. A year ago it was 37.2 percent, and in 2018 and 2019 it averaged about 56 percent. It peaked at 93 percent in April 2021, when buyers cleared nearly everything that came to market, fell back through 2022 and 2023, and has stayed between 34 and 37 percent since September 2024. This month’s reading is close to the low of 34.1 percent in September 2024. For every 100 new listings over the past year, about 37 sold. The market isn't getting worse on this measure, but it isn't getting better either.
A note on terminated listings. Habistat counts 163 terminated cottage listings for Q3 2026, against 173 in Q3 2025 (-6%), and 330 so far this year against 344. We compare only those two years. The recorded count ran at 51 in 2023 and 450 in 2025, while the number of listings leaving the market unsold, worked out from new listings, sales and active listings, rose 112 percent over the same two years. Most of that jump looks like a change in how listings are recorded, not a surge in withdrawals, so we no longer compare the count with the long-run average. Details are in the note at the end of this report.
Two more numbers show the balance.
Year to Date
Nine months, same picture
One quarter is a data point. Year to date is a trend, and I'd rather lean on it. Active listings have averaged 330 through September, 87 percent above the 8‑year YTD norm of 177 and up 10 percent on last year. New listings are at 1,240, down 2 percent but 30 percent above the norm. Sell‑through is 33.2 percent, with 412 sales against 1,240 new listings, about level with last year's 33.5 percent and well below the 8‑year YTD norm of 51.6 percent. The average month has carried 10.4 months of inventory, against 7.5 a year ago and a long‑run 4.3.
Sales are behind on both counts. We're at 412 so far, 3 percent behind last year's 425 and 14 percent below the 8‑year YTD average of 479. More supply, fewer sales, and that's been the shape of the whole year.
Demand
Sales are down on last year, and well below normal
Q3 2026 closed at 197 waterfront sales across Haliburton and Kawartha Lakes, all price ranges. July came in at 68, August at 60 and September at 69, all three confirmed from the multi‑board total.
Q3 cottage sales, 2025 to 2026
Full third quarter (July, August and September), vs. the 8-year Q3 average · Haliburton and Kawartha Lakes combined, detached waterfront
All three months confirmed. Source: MLS® board data, detached waterfront cottages, Haliburton and Kawartha Lakes combined, multiple real estate boards.
Against Q3 2025's 211, that's down 7 percent. Against the 8‑year average of 230, it's 14 percent below. Sales peaked in June at 93 and have run between 60 and 69 a month since.
Eight Years Out
The recovery has stalled short of the average
A quarter, or even nine months, doesn't tell you much without a longer frame. Here are annual cottage sales since 2018.
Annual cottage sales, 2018 to 2025
Compared against the 8‑year average · 2026 is excluded (partial year)
Navy bars without outline are 2018 and 2019, the pre-pandemic baseline. Source: MLS® board data, detached waterfront cottages, Haliburton and Kawartha Lakes combined, multiple real estate boards, 2018 through 2025.
2020 and 2021 were pandemic years, and I don't lean on them. After 2023's low of 344, sales rose to 449 in 2024 and 528 in 2025, two years of growth. The 8‑year average is 583, and 2025 finished 9 percent below it.
Our trailing twelve months, October 2025 through September 2026, sits at 515, down 2 percent from the prior twelve months' 524 and 12 percent below the 8‑year average. The recovery that started in 2024 has stalled.
On Price
Prices are up modestly, led by July
The Q3 average sale price was approximately $887,000, up 5 percent from $845,000 in Q3 2025. The Q3 median was approximately $749,000, up 6 percent from $707,000. Average and median rose at about the same pace, which tells you the gain wasn't a few big sales at the top.
It wasn't evenly spread through the quarter, though. July's median was about $840,000 against $711,000 a year earlier. August slipped to $691,000 from $716,000, and September recovered to $715,000 against $696,000. July did most of the work. Sale to list ratio was 95.8 percent, up about a point from Q3 2025's 94.8 and still about 2 points below the 8‑year norm.
What This Means
What this means right now
If you are buying
This is the best‑supplied market we've seen in these two regions since at least 2018, and prices are only a little higher than a year ago. You have choice and you have time. Don't rush into the overpriced listings. There are plenty of them, and they're the ones that sit.
If you are selling
You're competing with a record number of listings for a below‑average number of buyers, and months of inventory went up this summer when it should have come down. Price to where buyers actually are, and expect to negotiate. More than half of new listings didn't sell this quarter, and the ones that don't are typically listed above where buyers are, then sit and either re‑list lower or come off the market.
Questions on any of this? Give us a call.
Contact Us