
Market
Market
Ontario Cottage Market | 2026 Review & 2027 Outlook
Same as the Muskoka piece: this IS NOT AI slop. I write this stuff.
I’ve now looked at Muskoka, Parry Sound and Haliburton & Kawartha Lakes. This time I’m pulling back to the whole province, nine real estate boards worth of waterfront cottages, now with October in the numbers. The Ontario picture is different from Muskoka in one important way, and it changes how I read the market going into 2027.
The Ontario Cottage Market in a Nutshell
2026 so far
- Buyers are still showing up. 3,746 cottages sold from January to October, down 2.6% on 2025 and just 1% below the 2017 to 2025 average.
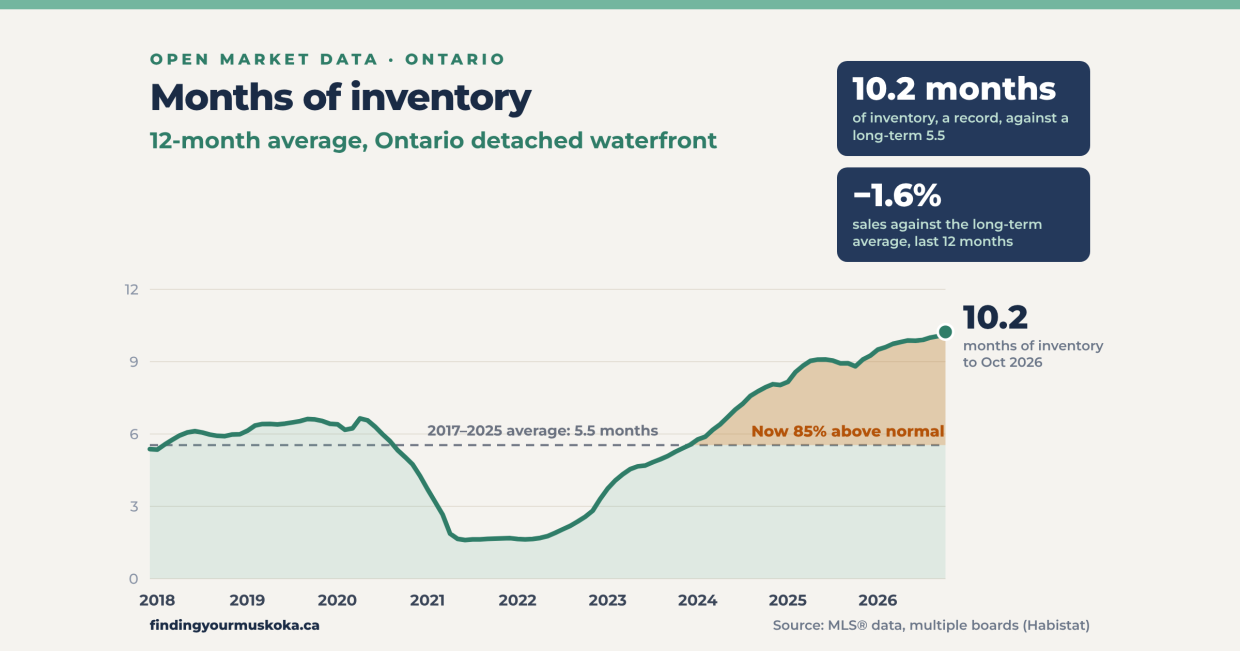
- Sellers are showing up in far greater numbers. New listings, at 12,154, are the most in our data, and average active listings are 94% above normal. Months of inventory over the last 12 months is 10.2 against a long-term 5.5, also a record.
- Prices are soft, not collapsing. The 12-month median is $785K, down 1.8% on a year ago and 15% below the July 2022 peak. Sellers are getting 95.1% of asking, the lowest in our data.
2027 outlook
- Listings stay at historical highs, particularly in the spring, when thousands of cottages that didn’t sell this year come back.
- Sales drop about 10%.
- Prices soften 5-10%.
- Luxury stays stable, particularly above $5M, the same as in Muskoka.
- The Cottage Forecaster. At the Q3 2026 update it reads Stable for Ontario cottages, with a score of −18.8. Correction starts at −25. See the Forecaster.
Ontario vs the regions
- Muskoka is the weak spot. From January to September, Muskoka sales ran 29% below their long-term average, against 1% for Ontario. Parry Sound was the only region to grow, up 18.7%. See how the regions compare.
What 2026 looked like
Here’s the surprise. Across the province, cottage sales are holding up. 3,746 waterfront cottages sold from January to October, down 2.6% on last year and within about 1% of the 2017 to 2025 average.
Over the last 12 months it’s 4,079 sales, 3.4% below the year before and 1.6% below the long-term average.
October came in at 387 sales against 470 a year ago. That figure will rise as late sales are entered over the next few weeks, so don’t read too much into it yet.
That’s a very different story from Muskoka, where sales are running almost 29% below normal. Ontario buyers haven’t gone anywhere. They’ve just moved toward the more affordable end of the market, where the provincial median sits at $785K against $1.22M in Muskoka.
Ontario Cottage Sales, 12-Month Rolling Total
Detached waterfront cottage sales in the 12 months ending each month, December 2017 to October 2026
| Period | Sales |
|---|---|
| 12 months to Dec 2017 | 3,488 |
| 12 months to Dec 2018 | 4,252 |
| 12 months to Dec 2019 | 4,251 |
| 12 months to Dec 2020 | 5,926 |
| 12 months to Dec 2021 | 5,643 |
| 12 months to Dec 2022 | 3,582 |
| 12 months to Dec 2023 | 2,749 |
| 12 months to Dec 2024 | 3,252 |
| 12 months to Dec 2025 | 4,180 |
| 12 months to Oct 2026 | 4,079 |
Each point totals the 12 months ending then. The average line is the mean of the calendar years 2017 to 2025. Source: MLS® data from nine Ontario boards (Habistat), detached waterfront cottages, monthly, January 2017 to October 2026.
The problem isn’t demand. It’s supply.
From January to October, 12,154 cottages came to market across the nine boards, the most in our data and 53% above the long-term average. Active listings averaged about 3,300, almost double normal, and peaked at 4,701 in July, the highest single month on record.
Months of inventory, averaged over the last year, has climbed to 10.2. The long-term average is 5½. That’s a record too.
The absorption rate puts it plainly. Over the last year about 11% of the cottages on the market sold each month, roughly 1 in 9. Across 2017 to 2025 it averaged 26%, or about 1 in 4. Sell-through tells the same story: about one sale for every three new listings, against one for every two over the long run.
Ontario Months of Inventory, 12-Month Rolling Average
Months of inventory (active listings divided by monthly sales), averaged over the 12 months ending each month, December 2017 to October 2026
| Period | Months of inventory |
|---|---|
| 12 months to Dec 2017 | 5.4 |
| 12 months to Dec 2018 | 6.0 |
| 12 months to Dec 2019 | 6.4 |
| 12 months to Dec 2020 | 4.3 |
| 12 months to Dec 2021 | 1.7 |
| 12 months to Dec 2022 | 3.3 |
| 12 months to Dec 2023 | 5.6 |
| 12 months to Dec 2024 | 8.0 |
| 12 months to Dec 2025 | 9.2 |
| 12 months to Oct 2026 | 10.2 |
Each point averages the monthly readings for the 12 months ending then. Source: MLS® data from nine Ontario boards (Habistat), detached waterfront cottages, monthly, January 2017 to October 2026.
What I see for 2027
The headwinds I described for Muskoka apply across the province, just with less force. The uncertainty tied to the United States is still the biggest weight on the market, and I don’t expect a meaningful change in direction while the current administration is in power. Interest rates are now going the wrong way too: the Bank of Canada raised its rate on October 28.
The difference is in what that does to each market. In Muskoka, buyers stepped back. Across Ontario, buyers kept buying but sellers kept listing, faster than buyers could keep up with. Terminations are up 8.9% on 2025 (3,499 against 3,212 from January to October), so a lot of that unsold inventory is coming back in the spring with new photos, new write-ups and lower prices.
For 2027, I expect Ontario cottage sales to drop about 10%, and prices to soften 5-10%. Listings stay at historical highs, particularly in the spring. The luxury segment should stay stable, particularly above $5M, the same as I expect in Muskoka, where that end of the market is concentrated on Lake Joseph, Lake Rosseau and Lake Muskoka. For how those three compare over the long run, see our Big Three comparison.
Upside: If energy prices ease and the Bank of Canada can reverse course, some calm on trade could pull more buyers off the fence. With sales already at normal levels, even a modest lift would start to chip away at inventory and steady prices.
Downside: If new listings keep climbing at this year’s pace, sales stay flat and the Bank keeps raising rates, months of inventory pushes past 11 and the price softening we’ve seen this year speeds up, especially on smaller lakes and in the higher-inventory regions.
Ontario New Listings Against Sales, 12-Month Rolling Totals
New listings and sales of detached waterfront cottages in the 12 months ending each month, December 2017 to October 2026
| Period | New listings | Sales |
|---|---|---|
| 12 months to Dec 2017 | 6,189 | 3,488 |
| 12 months to Dec 2018 | 8,329 | 4,252 |
| 12 months to Dec 2019 | 8,995 | 4,251 |
| 12 months to Dec 2020 | 7,711 | 5,926 |
| 12 months to Dec 2021 | 7,662 | 5,643 |
| 12 months to Dec 2022 | 7,459 | 3,582 |
| 12 months to Dec 2023 | 6,753 | 2,749 |
| 12 months to Dec 2024 | 10,248 | 3,252 |
| 12 months to Dec 2025 | 12,319 | 4,180 |
| 12 months to Oct 2026 | 12,800 | 4,079 |
Each point totals the 12 months ending then. Source: MLS® data from nine Ontario boards (Habistat), detached waterfront cottages, monthly, January 2017 to October 2026.
Prices have held up better than you’d expect with this much supply. The 12-month median is $785K, down 1.8% on a year ago and 15% below the July 2022 peak of $928K. It’s still well above where it sat before the pandemic, when the median was around $500K.
Look underneath the median and the pressure is there. Sellers are getting 95.1% of their asking price over the last year, the lowest in our data, down from more than 106% at the peak. Cottages are taking a median of 39 days to sell against a long-term 32.
Our Cottage Forecaster reads sold-listing data back to 2010 alongside economic signals and our own read from the docks. At the Q3 2026 update it reads Stable for Ontario cottages, with a score of −18.8. Correction starts at −25, and Muskoka cottages under $3M are already there, at −30. It’s refreshed every quarter.
See the Cottage Forecaster →Ontario Median Sale Price, 12-Month Rolling Average
Average of the monthly median sale prices over the 12 months ending each month, December 2017 to October 2026
| Period | Median sale price |
|---|---|
| 12 months to Dec 2017 | $438K |
| 12 months to Dec 2018 | $472K |
| 12 months to Dec 2019 | $505K |
| 12 months to Dec 2020 | $631K |
| 12 months to Dec 2021 | $839K |
| 12 months to Dec 2022 | $906K |
| 12 months to Dec 2023 | $825K |
| 12 months to Dec 2024 | $794K |
| 12 months to Dec 2025 | $795K |
| 12 months to Oct 2026 | $785K |
The source reports monthly medians only, so each point averages the 12 monthly medians ending then. The 2017 to 2025 average includes the much lower pre-pandemic years. Source: MLS® data from nine Ontario boards (Habistat), detached waterfront cottages, monthly, January 2017 to October 2026.
The Market Headwinds Going Into 2027
Here is what I’m watching across the province.
The U.S. trade dispute. Still the biggest weight on the market. Canadian consumer confidence was 47.3 in September, below its 2010 to 2026 average of 51.4, and foreign buyers still face the 25% NRST that has applied across Ontario since October 2022.
Record supply. New listings, active listings and months of inventory are all at the highest levels in our data. Even with sales at normal levels, it will take a long time for buyers to work through this much inventory.
Pricing power. Sale-to-list is at a record low and days on market are well above normal. Buyers have room to negotiate, and they know it.
Rates, prices and jobs. The Bank of Canada raised its rate to 2.5% on October 28, its first increase since 2023, and warned that more hikes could follow. Its next decision is December 9. The hike pushes variable mortgage rates up right away. The 5-year bond yield, which sets fixed mortgage pricing, was 3.60% on October 2, close to its 52-week high of 3.71%. Inflation was 3.1% in September (2.2% excluding gasoline), driven by a 27.8% jump in gas prices, and Canada lost 68,000 jobs in September, with unemployment up to 6.5%.
Sources: Bank of Canada, Statistics Canada (CPI and Labour Force Survey), Ipsos consumer confidence and Habistat. Rates and yields as of the dates shown.
Ontario Pricing Power: Sale-to-List and Days on Market
Sale price as a share of list price, and median days on market, sales-weighted over the 12 months ending each month, December 2017 to October 2026
| Period | Sale price as share of list | Median days on market |
|---|---|---|
| 12 months to Dec 2017 | 96.9% | 34 |
| 12 months to Dec 2018 | 96.0% | 40 |
| 12 months to Dec 2019 | 95.9% | 39 |
| 12 months to Dec 2020 | 98.3% | 29 |
| 12 months to Dec 2021 | 106.2% | 14 |
| 12 months to Dec 2022 | 100.7% | 20 |
| 12 months to Dec 2023 | 96.0% | 32 |
| 12 months to Dec 2024 | 95.2% | 39 |
| 12 months to Dec 2025 | 95.3% | 40 |
| 12 months to Oct 2026 | 95.1% | 39 |
Both series are sales-weighted averages of the monthly figures over the 12 months ending then. The sale-to-list axis starts at 90%. Source: MLS® data from nine Ontario boards (Habistat), detached waterfront cottages, monthly, January 2017 to October 2026.
Ontario Active Listings, 12-Month Rolling Average
Cottages on the market, averaged across the monthly counts for the 12 months ending each month, December 2017 to October 2026
| Period | Active listings |
|---|---|
| 12 months to Dec 2017 | 1,398 |
| 12 months to Dec 2018 | 1,872 |
| 12 months to Dec 2019 | 2,000 |
| 12 months to Dec 2020 | 1,299 |
| 12 months to Dec 2021 | 743 |
| 12 months to Dec 2022 | 899 |
| 12 months to Dec 2023 | 1,107 |
| 12 months to Dec 2024 | 2,119 |
| 12 months to Dec 2025 | 2,845 |
| 12 months to Oct 2026 | 3,048 |
Each point averages the monthly counts for the 12 months ending then. Source: MLS® data from nine Ontario boards (Habistat), detached waterfront cottages, monthly, January 2017 to October 2026.
How the regions compare
Ontario’s numbers are an average of very different markets. Here’s how the regions we cover stack up, using January to September for all of them so the comparison is like for like.
Parry Sound was the only region where sales grew, up 18.7%, though it’s still 18% below normal. Muskoka is the weakest: sales are 29% below its long-term average and prices are down 5.2%. Haliburton & Kawartha Lakes held steady on sales, but its two halves split on price, with Haliburton up 5.0% and Kawartha Lakes down 14.1%.
What every region shares is supply. Each one is carrying 1.6 to 2.1 times its normal months of inventory.
The Cottage Forecaster sees it the same way. Muskoka under $3M is in Correction, at −30. Everywhere else reads Stable, but none by much. Correction starts at −25, and Parry Sound is closest at −23.8, followed by Haliburton (−19.4), Kawartha Lakes (−18.9) and Ontario as a whole (−18.8).
For the full picture on each region, read the outlooks for Muskoka, Parry Sound and Haliburton & Kawartha Lakes.
Cottage Sales by Region: Against Last Year and Against Normal
Change in detached waterfront cottage sales, January to September 2026, against 2025 and against each region’s long-term average
| Region | Against 2025 | Against long-term average |
|---|---|---|
| Parry Sound | +18.7% | −18.1% |
| Ontario | −0.5% | −1.1% |
| Haliburton & Kawartha | −2.8% | −13.8% |
| Muskoka | −3.7% | −28.9% |
Long-term averages are 2017 to 2025 for Ontario and 2018 to 2025 for the regions, where board coverage was limited before 2018. Source: MLS® data from multiple boards (Habistat), detached waterfront cottages, January to September of each year.
| Region, January to September 2026 | Sales against 2025 | Sales against long-term average | Active listings against long-term average | Months of inventory against normal | Median sale price | Sale-to-list | Cottage Forecaster™ |
|---|---|---|---|---|---|---|---|
| Ontario | −0.5% | −1.1% | +94% | 1.9× | $794K (−1.2%) | 95.3% | Stable (−18.8) |
| Muskoka | −3.7% | −28.9% | +61% | 2.1× | $1.22M (−5.2%) | 94.6% | Correction under $3M (−30); Stable at $3M and over (−10) |
| Parry Sound | +18.7% | −18.1% | +47% | 1.6× | $820K (+8.1%) | 95.2% | Stable (−23.8) |
| Haliburton & Kawartha Lakes | −2.8% | −13.8% | +87% | 2.0× | Haliburton $806K (+5.0%); Kawartha $815K (−14.1%) | 95.9% | Stable: Haliburton −19.4; Kawartha −18.9 |
All figures are detached waterfront cottages, January to September 2026, so Ontario’s numbers here differ slightly from the January to October figures above. Long-term averages are 2017 to 2025 for Ontario and 2018 to 2025 for the regions. “Months of inventory against normal” compares each region’s months of inventory with its own long-term average. Median prices are the average of monthly medians; Haliburton and Kawartha Lakes are shown separately because medians can’t be combined. Cottage Forecaster readings are from the Q3 2026 update; a score below −25 reads Correction.
Using our data? Go for it.
A lot of agents, brokerages and journalists use our numbers and outlooks, and we’re glad they do. That’s why we publish them. All we ask is a credit and a link back to the source, so your clients can see where the figures came from.
Source: Finding Your Muskoka, findingyourmuskoka.ca
Need a chart, a number or a different cut of the data? Get in touch and we’ll help if we can.
About the data. The figures in this post come from The Habistat, an analytics tool powered by PropTx that combines MLS® data from nine Ontario real estate boards, and cover detached waterfront cottages, including water-access cottages, across those boards. Charts use 12-month rolling figures to smooth out the strong seasonality in cottage sales; the text compares January to October of each year. The long-term average is the mean of the calendar years 2017 to 2025, the full years in our Ontario export. The boards in the dataset:
- North Bay Real Estate Board
- Oakville, Milton and District Real Estate Board (OMDREB)
- OnePoint Association of REALTORS®
- Ottawa Real Estate Board (OREB)
- Peterborough and the Kawarthas Association of REALTORS® (PKAR)
- REALTORS® Association of Hamilton-Burlington (RAHB)
- Timmins Cochrane and Timiskaming Districts Association of REALTORS® (TCTDAR)
- Toronto Regional Real Estate Board (TRREB)
- Woodstock-Ingersoll and Tillsonburg Area Association of REALTORS® (WITAAR)
Figures use the latest data, updated to include October 2026; recent months can still rise slightly as late-entered closings are added. Only MLS®-listed sales are counted, so private and exclusive sales are not captured. Termination counts are compared year over year only. MLS®, REALTOR® and the associated logos are trademarks of The Canadian Real Estate Association. More at our Open Market Data and the Cottage Forecaster.
How these figures are built: see our full methodology.
Questions or comments? Contact John Fincham, Broker @ RE/MAX Parry Sound Muskoka Realty Ltd. Brokerage