

Market
Market
Muskoka Cottage Market Q3 2026: Buyers Gain More Ground
Q3 2026 Market Report
The Muskoka Cottage Market, By the Numbers
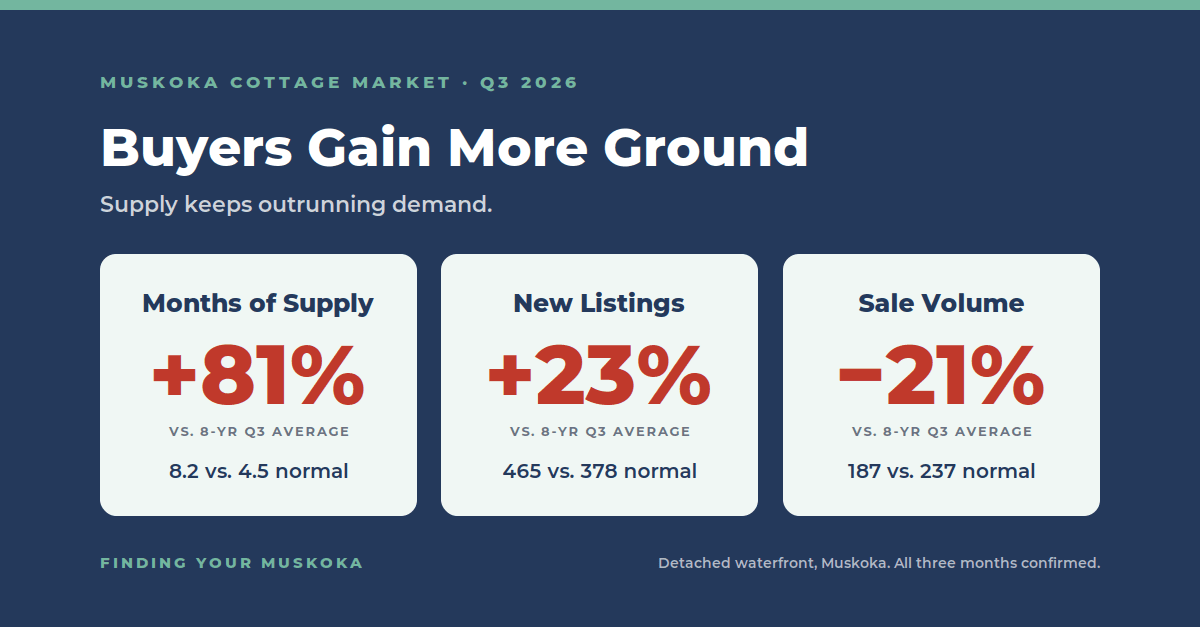
Q3 is in, and all three months are now confirmed. 187 cottage sales in Muskoka across multiple real estate boards, 7 percent below last year and 21 percent below the 8-year Q3 average. Only 40 of every 100 new listings sold, against 63 on the 8-year average. Here is what the numbers actually show, and where our own read on last quarter held up.
Q3 2026 vs Q3 2025 / At a glance
Cottage sales
Months of inventory
New listings
Avg. sale to list price
Sell-through
Over $3M sales †
Q3 2026 vs Q3 2025 figures cover detached waterfront cottages, multiple real estate boards (see the note at the end of this report). July, August and September 2026 are all confirmed. 8‑yr averages use 2018–2025. † Over $3M figures are from OnePoint Association of REALTORS® listing data, not the multi‑board totals used elsewhere in this report, and do not capture off‑market luxury sales.
187 detached waterfront cottages sold in Muskoka across multiple real estate boards in Q3 2026, with July, August and September all confirmed. The number I'd anchor on is the 8-year Q3 average of 237: we're 21 percent below it. That's a smaller gap than Q2 showed against its own average, but that's the seasonal high point of the year doing what it normally does. It isn't the market getting healthier.
Against last year the picture is a little softer than it first looked. Sales are down 7 percent from Q3 2025's 202. Months of inventory eased from Q2's 10.0 down to 8.2, the usual pattern as summer buyers show up, but 8.2 months is still 81 percent above the historical Q3 norm, at the point in the year when inventory is supposed to be at its most manageable. Sell-through, the share of new listings that actually sell, slipped too, from 48 percent a year ago to 40 percent. That's the throughline of this report.
The Quarter
Q3 sales slipped from last year. They are still well below average.
Q3 2026 closed at 187 cottage sales across all Muskoka, in all price ranges. July came in at 65, August at 59 and September at 63, all three confirmed from the multi-board total.
Q3 cottage sales, 2025 to 2026
Full third quarter (July, August and September), vs. the 8-year Q3 average · multiple real estate boards, detached waterfront
All three months confirmed. Source: MLS® board data, detached Muskoka waterfront cottages, multiple real estate boards.
Last year's Q3 came in at 202 sales. This year's 187 is 7 percent below that, a reversal from the modest gain Q2 posted over its own year-ago quarter, and 21 percent below the 8-year average of 237. That's a narrower gap than Q2's 31 percent, mostly because summer is naturally the strongest quarter of the year, not because demand has actually strengthened.
Year to Date
The nine-month view is no better
One quarter is a data point. Nine months is a trend, and I'd rather lean on the trend. Through September, Muskoka has seen 339 cottage sales, 4 percent behind the same nine months of 2025 (353) and 29 percent below the 8-year YTD average of 478. Q3 was a bigger miss against last year than the year to date as a whole, which tells me the summer was a little softer than the spring was.
Supply tells the same story. Sell-through year to date is 28.4 percent, with 339 sales against 1,192 new listings. That's down from 32.2 percent a year ago and well below the 8-year YTD norm of 48.7 percent. Active listings have averaged 340 through September, 61 percent above the 8-year YTD norm of 212, and the average month has carried 12.0 months of inventory against a long-run 5.6.
Eight Years Out
Eight years of context: where 2026 actually sits
A single quarter doesn't tell you much without a longer frame. Here are annual cottage sales since 2018, the earliest year with complete multi-board coverage.
Annual cottage sales, 2018 to 2025
Compared against the 8‑year average · 2026 is excluded (partial year)
Navy bars without outline are 2018 and 2019, the pre-pandemic baseline. Source: MLS® board data, detached Muskoka waterfront cottages, multiple real estate boards, 2018 through 2025.
2020 and 2021 were not normal years. Pandemic demand pulled years of activity into a short window and the correction that followed was real. Since 2022, sales have settled into a consistent band of 416 to 471 annually, averaging 440. Our trailing twelve months, October 2025 through September 2026, sits at 418, right at the bottom of that same range and about 5 percent below the prior twelve months at 438.
Against the 8-year average of 579 the market is down about 28 percent. Against the post-correction range it's sitting at the floor rather than the middle of the band. The market has stabilised at levels well below historical norms, and right now it's at the low end of where it has stabilised. Both of those things are true at the same time, and both matter depending on your position in this market.
The Supply Story
What's driving the imbalance
Sales running below last year is only part of the picture. Inventory keeps building on a year-over-year basis even as it eases seasonally, and a shrinking share of what gets listed is actually selling. The chart below tracks sell-through, sales as a share of new listings, over a rolling 12 months, which smooths out the seasonal noise in the monthly counts.
Sell‑through: 12‑month rolling share of new listings that became a sale
December 2018 through September 2026 · multiple real estate boards, detached waterfront
Scroll to explore →
Source: MLS® board data, detached Muskoka waterfront cottages, multiple real estate boards, December 2018 through September 2026. Sell‑through is sales divided by new listings.
Over the 12 months to September 2026, 418 cottages sold against 1,323 new listings, a sell‑through of 31.6 percent. A year ago it was 36.6 percent, and in 2018 and 2019 it averaged about 53 percent. It peaked at 92 percent in May 2021, when buyers cleared nearly everything that came to market, fell back through 2022 and 2023, and has stayed between 32 and 37 percent since September 2024. This month’s reading is the second‑lowest of any rolling 12 months in our data, behind only August 2024’s 31.3 percent. For every 100 new listings over the past year, about 32 sold.
A note on terminated listings. Habistat counts 183 terminated cottage listings for Q3 2026, against 128 in Q3 2025 (+43%), and 288 so far this year against 235. We compare only those two years. The recorded count ran at 19 in 2023 and 322 in 2025, while the number of listings leaving the market unsold, worked out from new listings, sales and active listings, rose 21 percent over the same two years. Most of that jump looks like a change in how listings are recorded, not a surge in withdrawals, so we no longer compare the count with the long-run average. Details are in the note at the end of this report.
Two numbers give a cleaner read on the current balance of the market.
Buyers are still active. The Q3 sales number confirms that. The issue isn't demand collapsing, it's that supply keeps arriving faster than the market can absorb it, and a meaningful share of sellers still aren't priced where buyers actually are.
On Price
Average price and median price: why the gap matters
The Q3 average sale price was approximately $1.94 million. The Q3 median was approximately $1.24 million. That $700,000 gap is what happens when a handful of high-end transactions pull the average well above where most of the market is actually trading. One sale at $8 million moves the average further than ten sales at $1 million.
The median is the midpoint where half the sales happened above and half below. It was up from $1.06 million in Q3 2025, a 16 percent gain. The average moved up too, from $1.69 million to $1.94 million, a slightly smaller 14 percent gain. Month by month, though, the median slid from $1.405 million in July to $1.2 million in August and $1.1 million in September, so the quarter's strength was front-loaded. September's median still sits above last September's $1.025 million. Use the one that fits what you're actually buying or selling; the median is the better read on a typical transaction, the average is more sensitive to whatever happened to close at the top of the market that quarter.
Sale to list ratio in Q3 was 94.4 percent, essentially flat from Q3 2025's 94.5 and a touch below Q2's 95.0, and about 2.3 points below the 8-year historical average of 96.7. There's negotiating room, but this isn't a market of deep discounts. Cottages priced to where buyers actually are sell. The sell-through chart above shows how many aren't.
Two Markets in One
The luxury segment reversed course this quarter
For those who have followed our market commentary closely, this divergence comes as no surprise, though the direction it moved in this quarter does. We began identifying the structural conditions for a two-tier cottage market as early as 2020, when the pandemic created two distinct buyer cohorts in Muskoka: those entering below $3 million, and those transacting above it, for whom a future price correction carries little weight in the buying decision. In Q2 2026, that thesis held again: the over-$3M segment grew 21 percent while the broader market was roughly flat. This quarter it flipped.
15 waterfront cottages sold above $3 million in Q3 2026, down from 27 in the same quarter last year, a 44 percent drop. That segment fell harder than the broader market, which was down 7 percent over the same period. The over-$3M share of all Q3 sales dropped to 8 percent, from 13 percent a year ago and well below the roughly 11 percent this segment has typically represented over the past 8 years.
We'd read this with some caution: a meaningful share of listings above $3 million sell off-market through private, unlisted transactions, so this comparison reflects what closed through OnePoint specifically, not necessarily the complete luxury market. But directionally, this is the first quarter in a while where the top of the market cooled faster than the rest of it, worth watching rather than dismissing as noise.
What This Means
What this means right now
If you are buying
Conditions are still leaning your way, and this quarter didn't change that. Inventory, time, and negotiating room are all still available. Not every seller has accepted where the market is. You will still see overpriced listings sit and eventually come off the market. Walk away from those.
If you are selling
The gap between listing and selling hasn't closed. Buyers are out there, the sales number confirms that, but they're not chasing anything. Price it to today's market, not to where it was in 2022 or even a year ago. The sell-through number in this report isn't abstract: roughly 60 of every 100 new listings didn't sell this quarter, and the ones that don't are typically listed above where buyers are.
Checking Our Work
What we got right, and wrong, last quarter
Our Q2 report made two calls worth checking rather than quietly moving past. We said "the floor appears to be in" on sales, based on Q2's modest year-over-year gain. Q3 came in 7 percent below last year and the nine months are running 4 percent behind, so that read looks less clean than it did three months ago. It's not a collapse, and the trailing twelve months at 418 are still inside the post-2022 band, but we'd rather flag the wobble than pretend the read was clean.
We also wrote that our two-tier luxury market thesis, sub-$3M and over-$3M cottages moving differently through a cycle, had "been confirmed every quarter since" we first identified it in 2020. That streak broke this quarter. The over-$3M segment fell harder than the broader market instead of outperforming it, the opposite of what Q2 showed. We're not abandoning the thesis over one quarter, but a pattern that had held for years just showed its first real exception, and that's worth naming plainly rather than letting it pass without comment.
We also changed how this report handles terminated listings. An earlier draft compared Q3's count with the long-run average and called it eight times normal. When we tested that against the number of listings that actually left the market without selling, which we can work out from new listings, sales and active listings, the comparison fell apart. The recorded termination count went from 19 in 2023 to 322 in 2025, while listings leaving the market unsold rose about 21 percent. That points to a change in how listings are recorded, not a surge in withdrawals, so the story here now rests on sell-through and inventory, which don't depend on that label.
Questions on any of this? Give us a call.
Contact Us